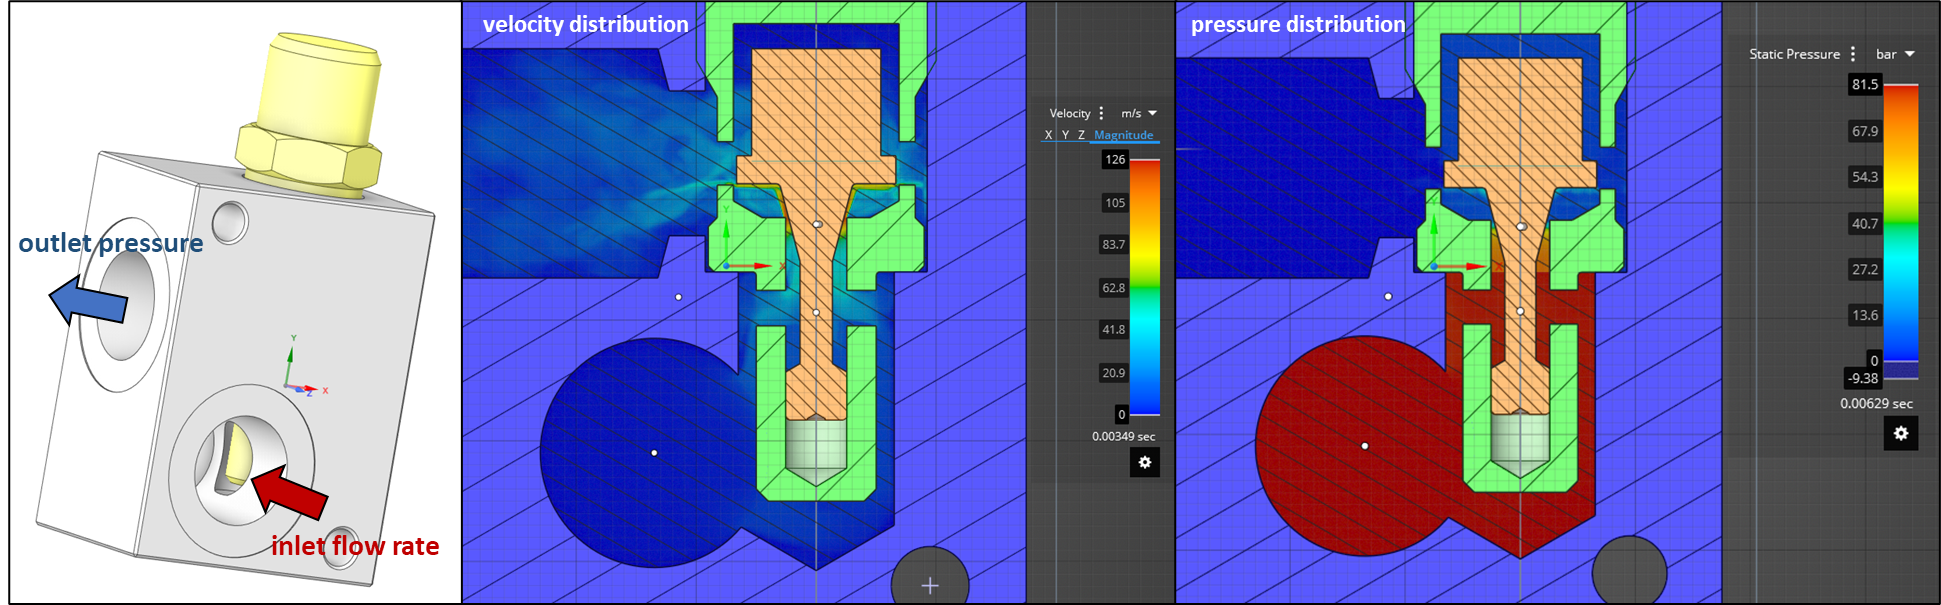
One of the uses of CFD simulations for our purposes is to allow a more accurate calibration of dynamic models made with the SmartFluidPower library. Below are the results of some CFD simulations on the spool of the pressure relief valve modeled in order to evaluate the 3D interactions of the flow with the geometry. The hydraulic valve is inserted in a test manifold, with imposed inlet flow and outlet pressure and ISO-VG 46 oil at 40 °C as fluid: in particular, the figure shows the velocity and pressure distributions in the case of 10 l/min flow rate and stroke 0.6mm.
To the geometry of the original spool (STANDARD) two alternative geometries (DESIGN 1 and DESIGN 2) are added to the tests: in the first the original plate is moved away from the sealing point by 1mm, in the second the diameter of the plate is reduced by 1.2mm. All geometries are simulated with CFD by varying the stroke imposed on the spool up to 1.2mm and the flow rate up to 30 l/min: from the results the flow forces on the spool are calculated, thus including both those due to the opening of the spool, and those due to the push of the flow on the plate. The figure below shows the differences between the tested geometries and the flow force results for each (considered positive at spool opening) in 3D graphs as a function of stroke and flow rate.

The virtual model built previously was simulated considering an average contribution of the flow forces (through the theoretical formulation and a coefficient) which resulted up to a maximum of about -20 N: the negative sign in our convention indicates the closing direction of the poppet, as is natural for the flow forces. However, the previous calculations did not consider the presence of the plate which, especially in the STANDARD case, in addition to compensating for the natural flow forces, leads them to much higher positive values (as shown by the graphs above). The hydraulic model is then parameterized more accurately by inserting the values obtained from the CFD and the simulations of the characteristic curves with flow rate ramp are repeated for the 4 calibration values: the following graphs compare the previous results on the STANDARD geometry (obtained with the theoretical formula) with those after the CFD calibrations of the same geometry and of the 2 alternatives.
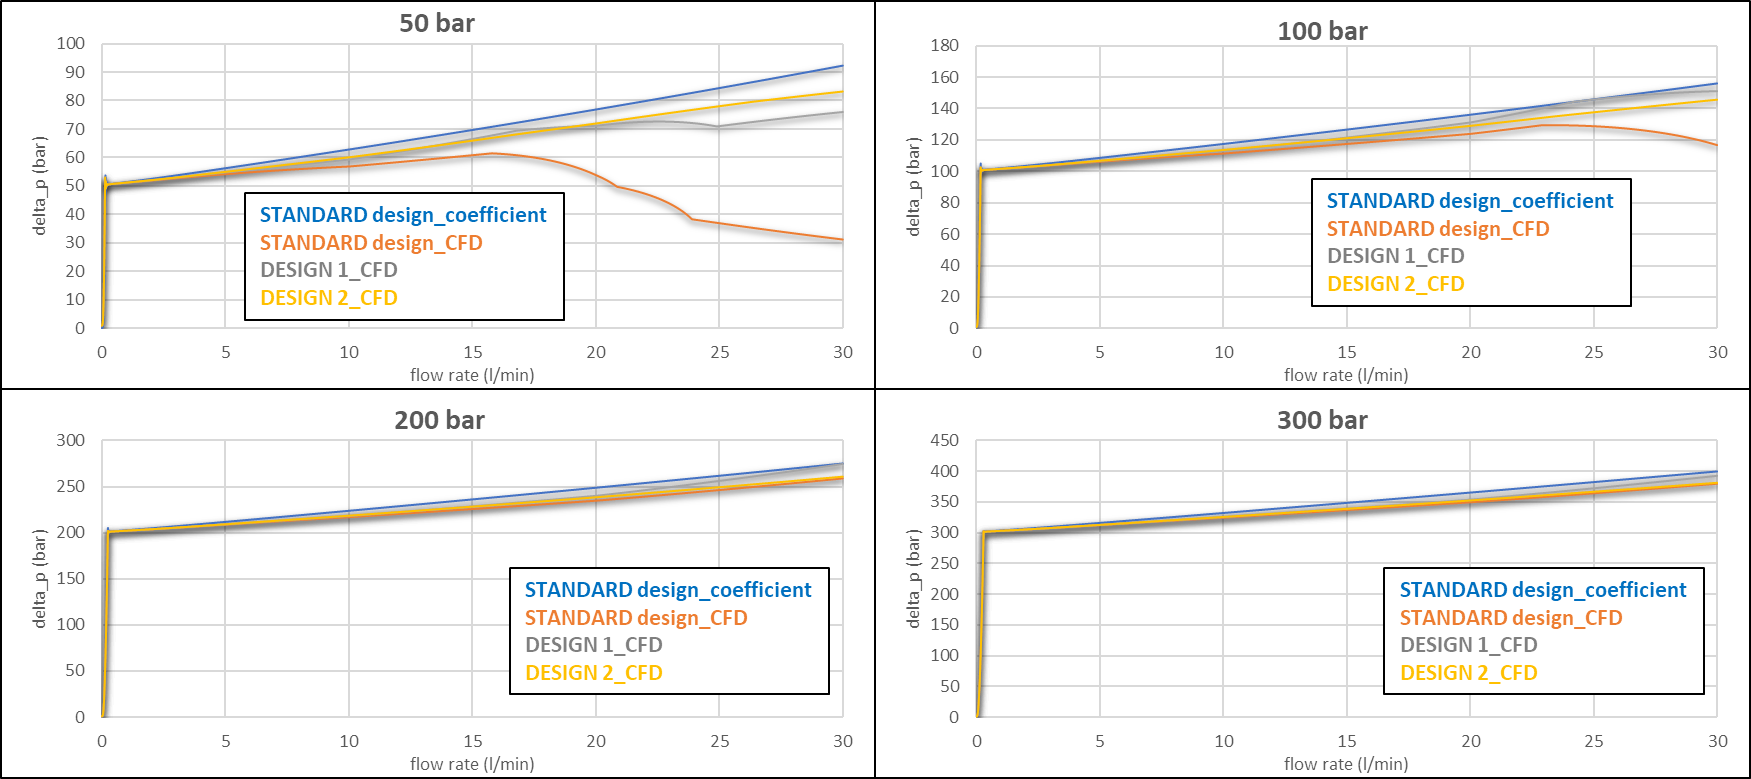
The results show how the influence of the plate is very evident in the standard geometry and radically modifies the valve performances compared to those calculated without CFD simulations, especially at lower cracking pressures: with higher ones (therefore greater forces from spring preload and stiffness) the difference tends to be reduced. Furthermore, the 2 alternative designs reduce the influence of the plate in the spool opening push, in fact they tend to ‘come out’ from the track of the flow towards the outlet: as could also be guessed from the similar results of the flow forces, they have comparable effects and less evident differences at higher calibrations.
These results show how an accurate calibration of the virtual model (in this case with CFD simulations) can be fundamental in predicting the performance of a component under certain operating conditions.